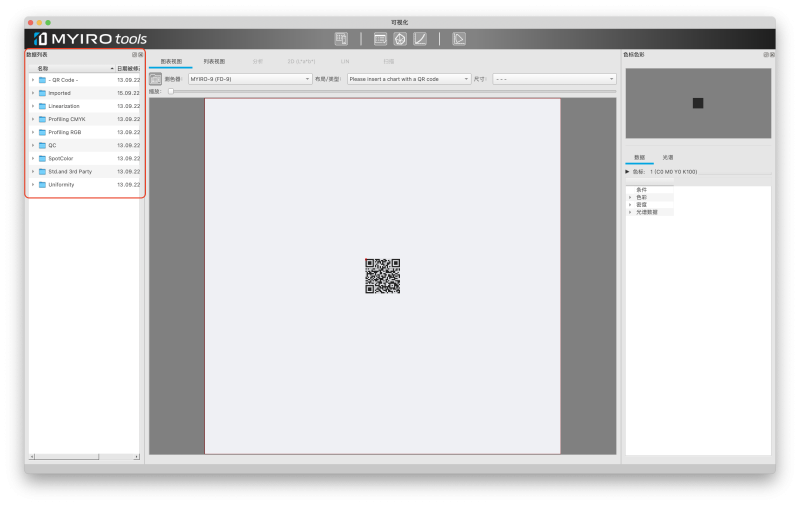
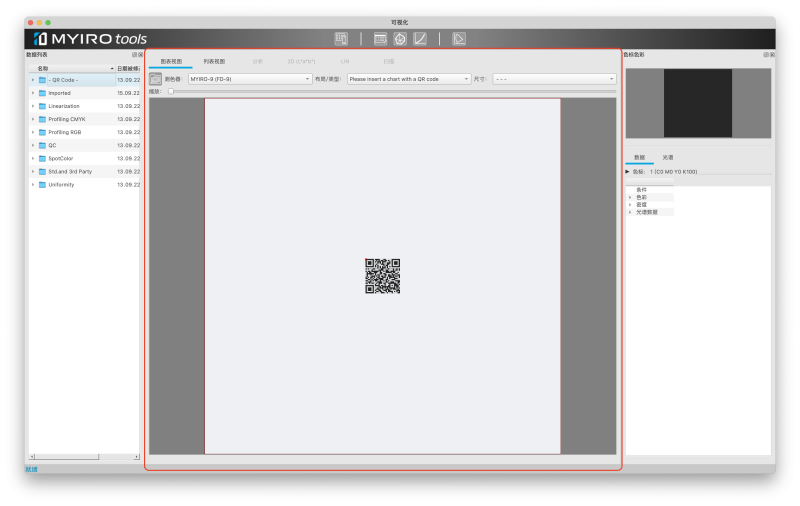
如果你的印刷品包含MYIRO-9的QR码,请选择这个文件夹。
正确的文件夹将由MYIROtools来选择。
这个文件夹包含了使用 "文件"-"导入图表 "导入的图表定义。
此文件夹包含两组用于线性化的图表
- Compose (与 Compose RIPs 一起使用的图表)
- G7 线性化
- P2P51
- TC1617
该文件夹包含三个图表。
- CMYK-420
- CMYK-840
- CMYK-2520
该文件夹包含三个图表
- RGB-420
- RGB-840
- RGB-2520
该文件夹包含五个图表
- FOGRA MediaWedge V3.0
- IDEAlliance ISO 12647-7 Control Wedge 2013
- JapanColor Control Strip
- JMPA Color 2018 Control Strip
该文件夹包含几个定义图表,常用于印刷行业。
根据布局,您无法使用所有仪器进行测量。
MYIROtools安装包中不包含打印文件。
- ECI2002
- GMG Flexo-Chart V2
- IDEAlliance P2P51
- IDEAlliance TC1671
- IT8/7.4
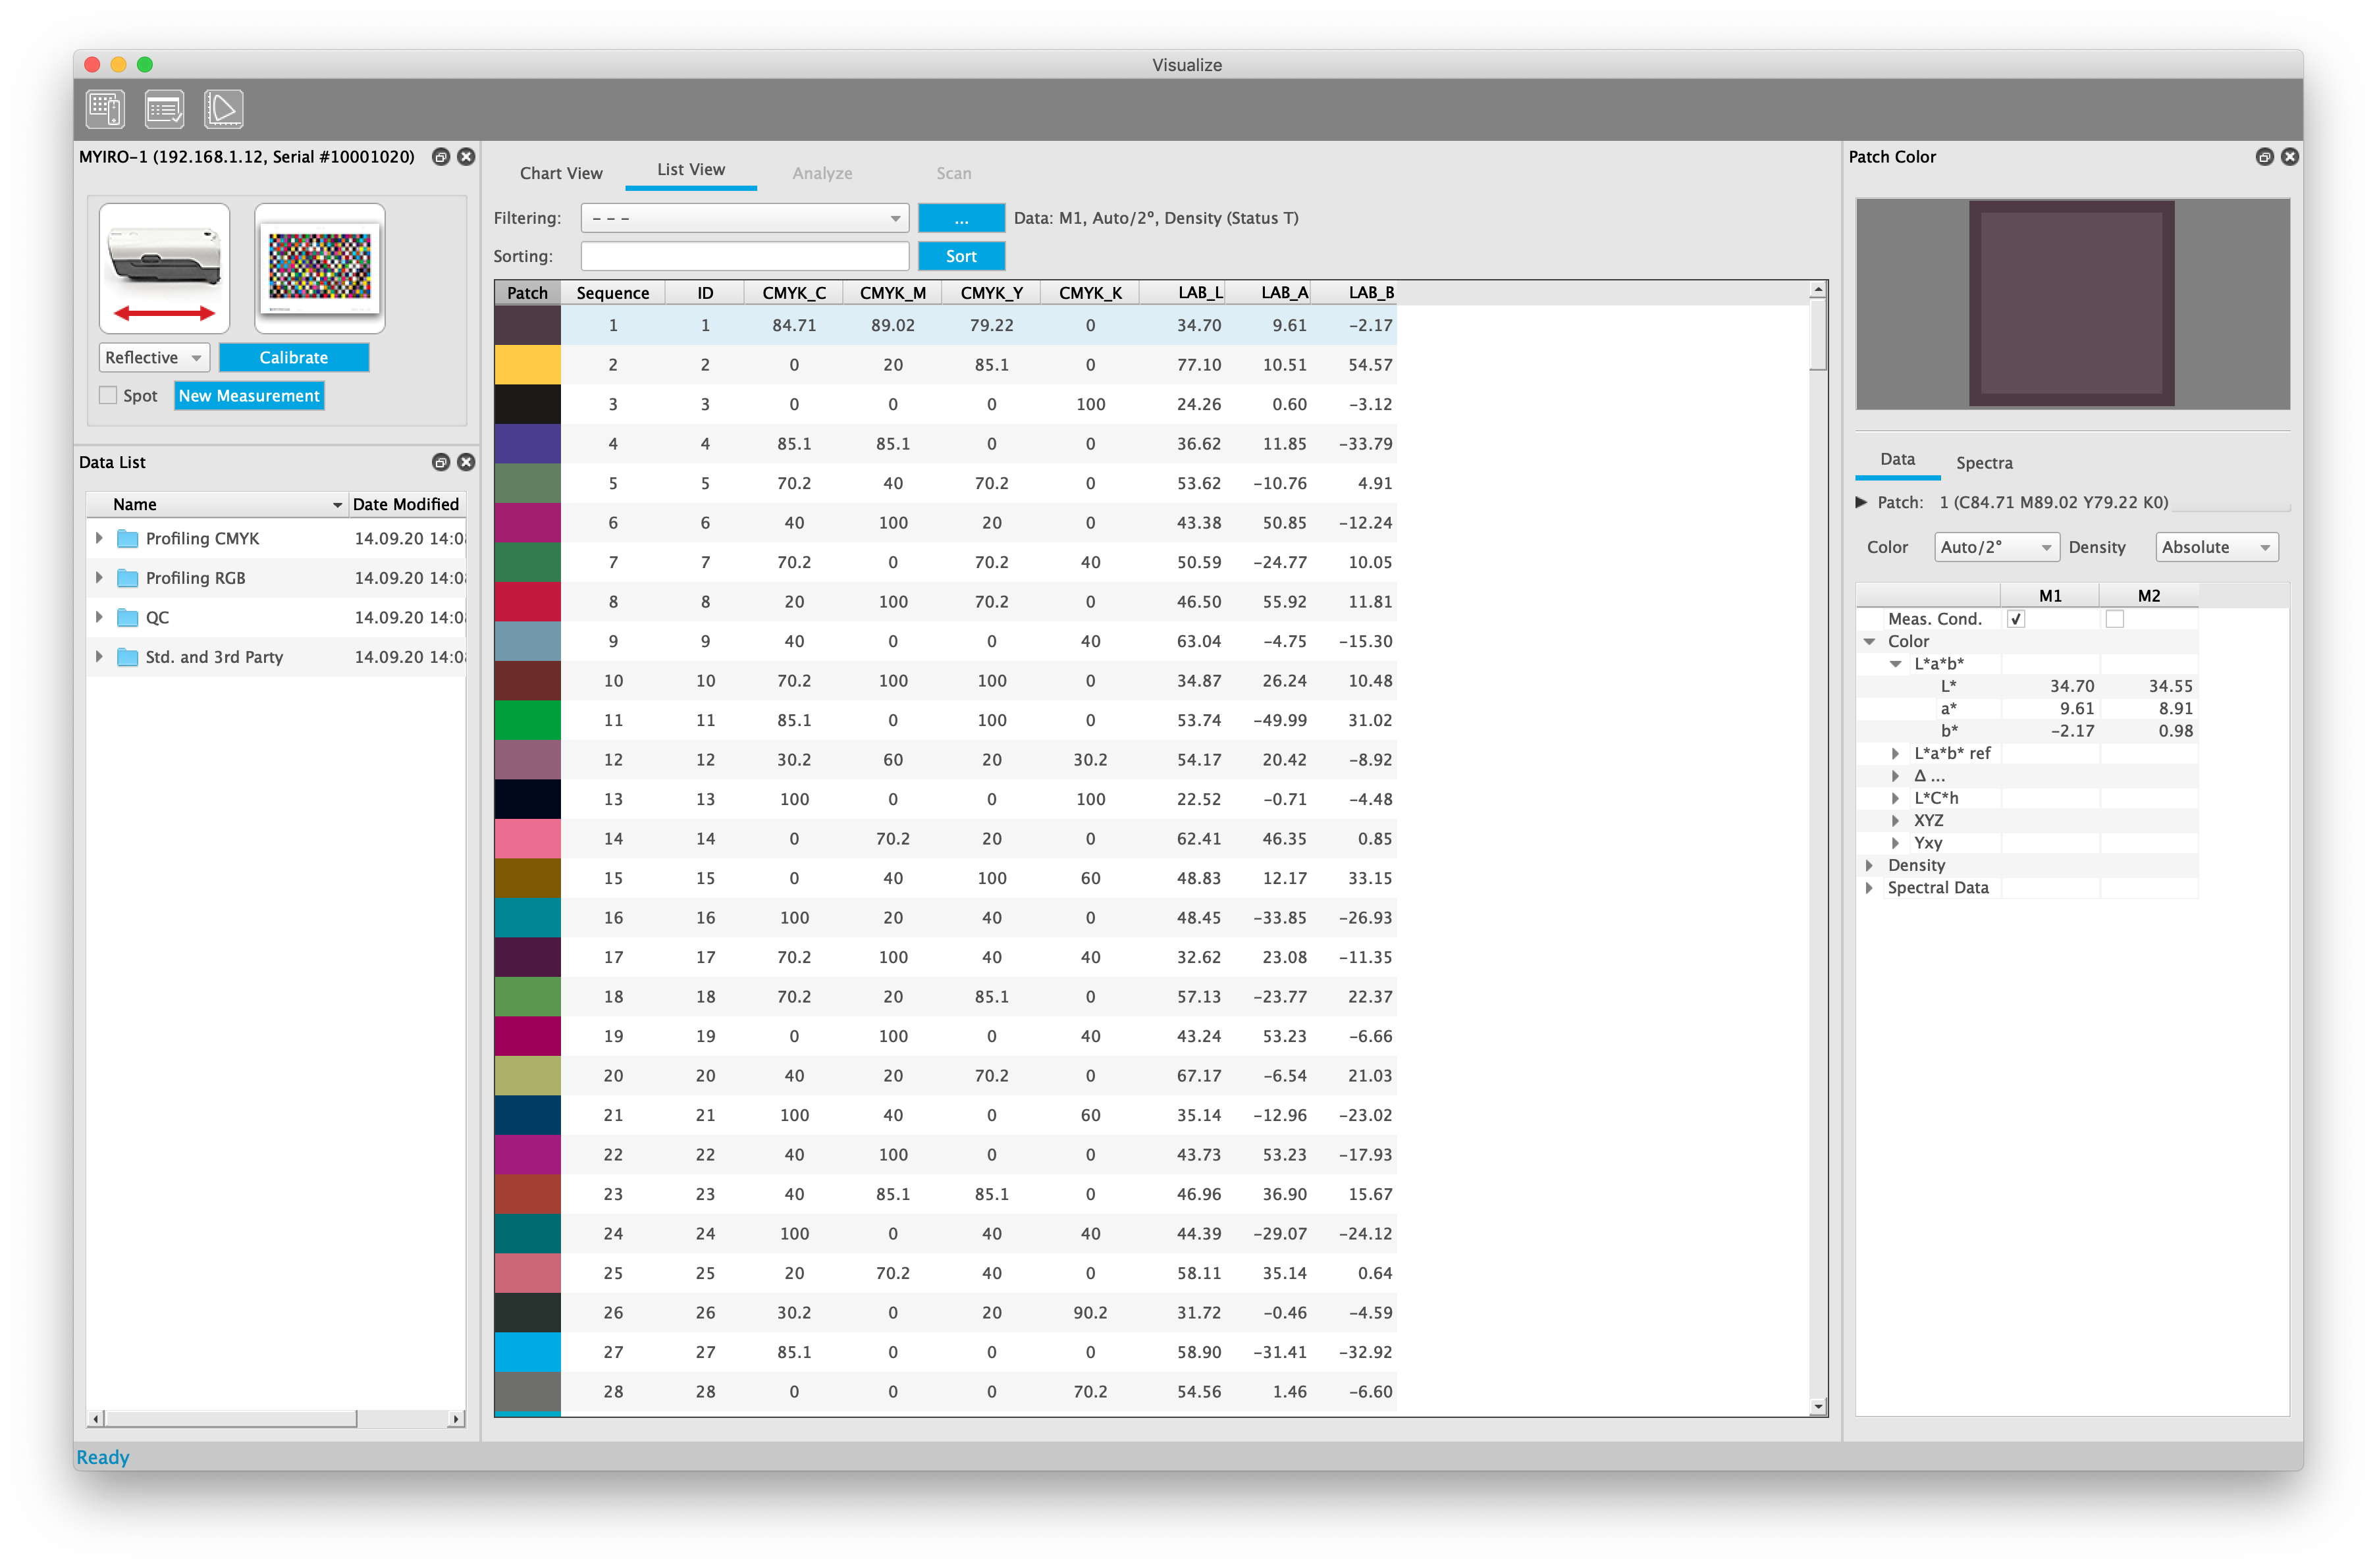
您可通过点击“图表视图”、“列表视图”、“Analyze”和“扫描”更改不同的查看模式。根据“数据列表”中的选择,可在窗口顶部选择图表的不同实例。
可用的转换有
- 仪器
- 布局/类型
- 大小
如果图表有多个页面,就会激活 在页面间切换或切换完整概要的箭头。
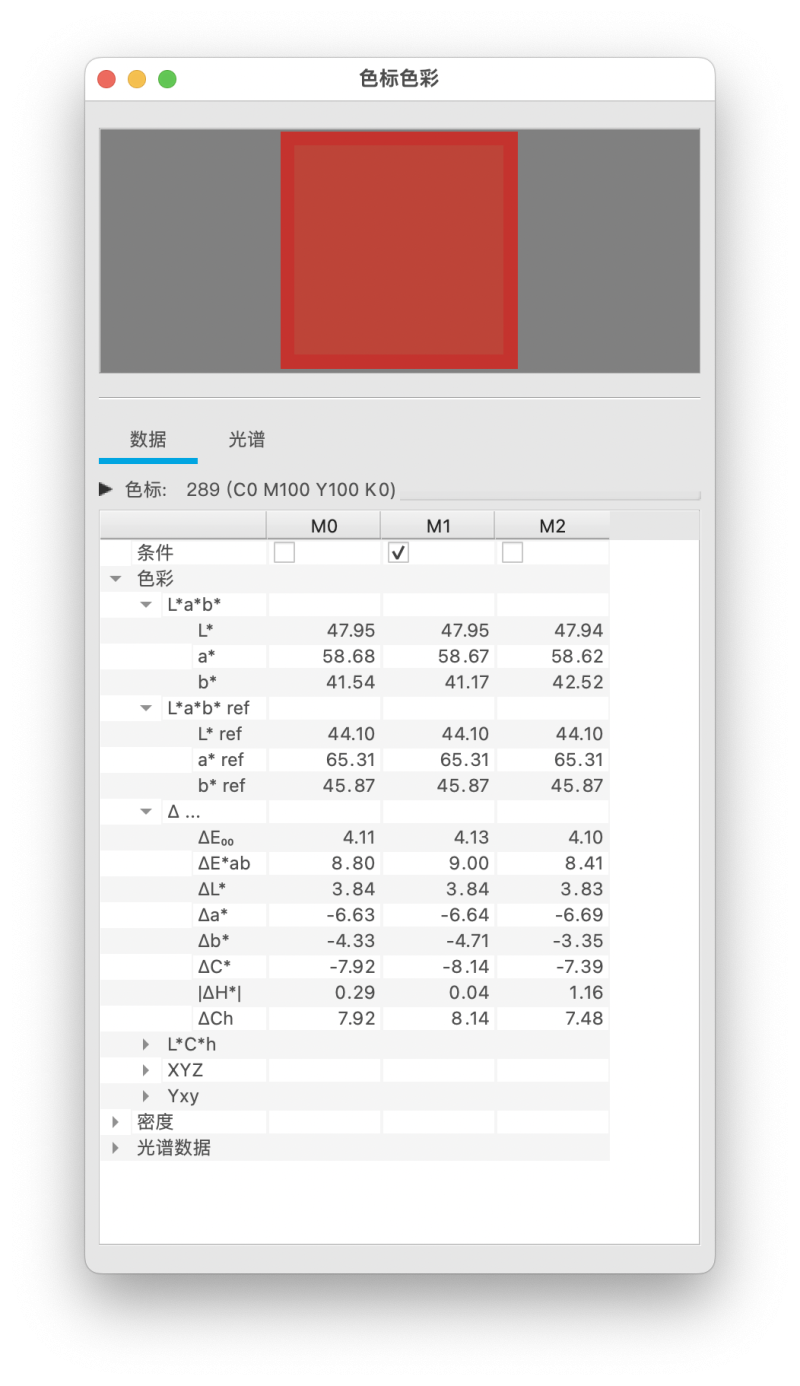
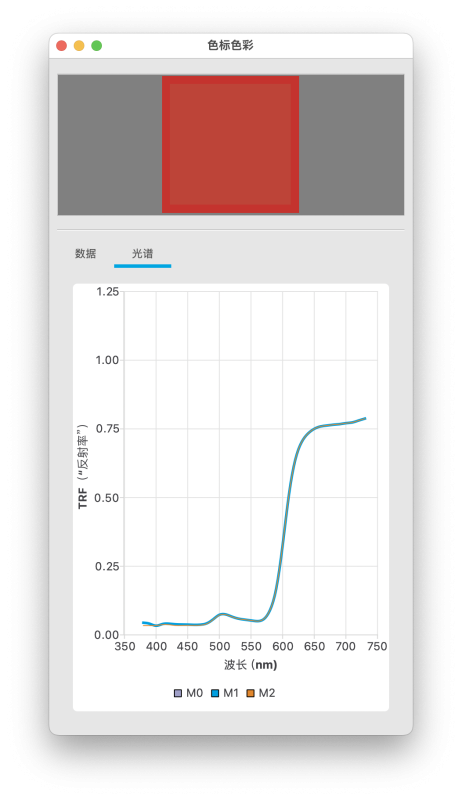
If a patch is selected by clicking on it, the window "Patch Color" shows the details of the selected patch.
If a measurement file is selected from the "Data List", all patches show a preview of the measured value (center) as well as a preview calculated from the device value (border) of the chart. In case the border of a patch shows a huge color difference compared to the center (e.g. green instead of red) it is likely that a measurement error occured.
MYIROtools提供模板来创建Spotcolor参考。
你可以在数据列表窗口的 "SpotColor "文件夹中找到它们。
选择一个与你需要测量的样品数量相对应的模板。
通过点击右上角的 "编辑",你可以为每个色板输入名称。
双击色板行中的 "名称 "字段,输入一个名称。
在数据列表中右键点击你的测量文件。
选择 "重命名 "并输入一个有意义的名字。
选择你的测量文件并选择文件->导出为...
选择 ASE 将您的定义导入设计软件,如 Adobe Illustrator 或 Affinity Designer。
选择CxF在配方软件中使用光谱数据或将光谱定义嵌入到PDF中。
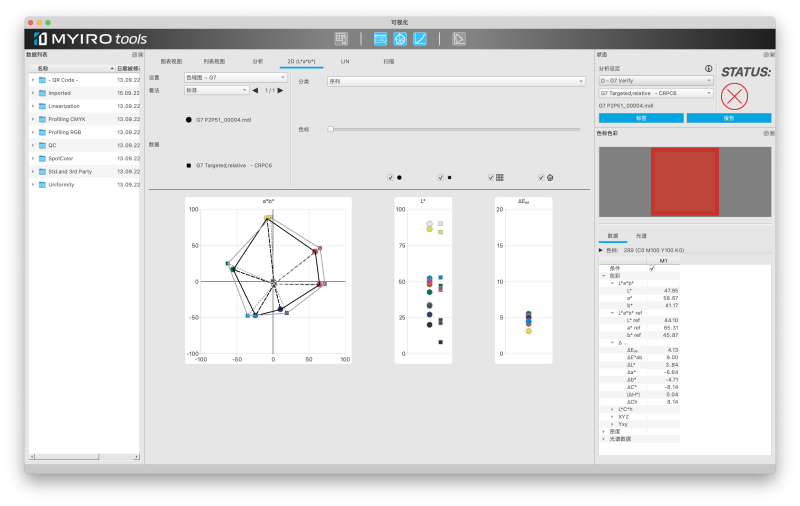
该窗口显示二维G7色域图(G7 Targeted)。
将用于检查G7 Targeted一致性的最重要色块的测量值绘制成两张图:
- CIEa*/CIEb*
- CIEL*
将色差分布绘制到∆E00图形中。
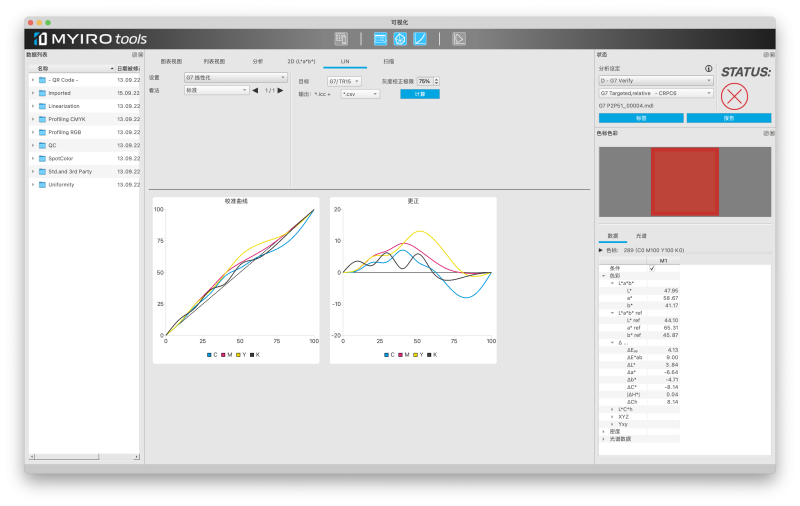
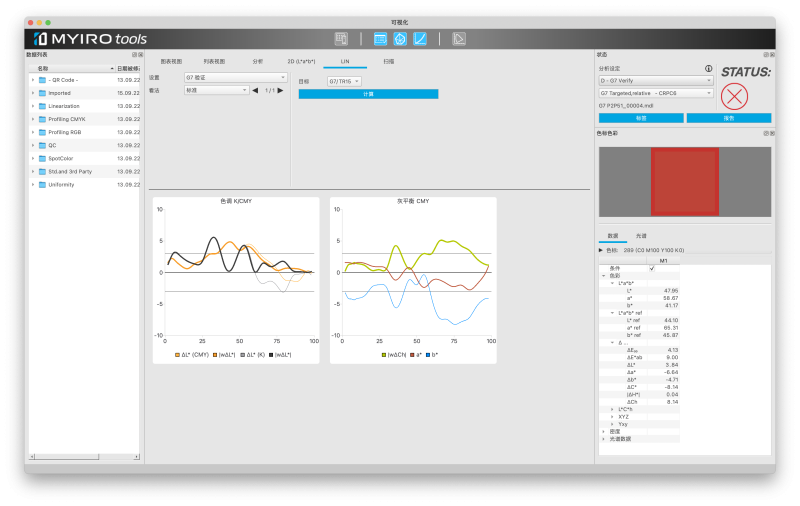
该选项卡有两个功能:
- 显示G7线性化的结果
- 将G7灰度评价的结果绘制为曲线
可用的选项有:
- G7线性化
- G7验证
G7线性化
按下“计算”后,MYIROtools会显示生成的校准曲线以及必要的校正。

